Bnibling/Acoustic Lab
From Physiki
Spectroscopy
Barrett Nibling, Travis Nokes, Kurt Strovink
November 6th, 2007
Contents |
Abstract
List of Figures
Introduction
Theory
Procedure

Results
Helium Results
| Color | θdiff (degrees) | λ (nm) | Error (nm) | Published λ (nm) | |
|---|---|---|---|---|---|
| Purple | 15.6 | 448.0 |  2.0 2.0
|
447.148 | |
| Teal | 16.4 | 470.3 | 2.0
|
471.314 | |
| Green | 17.2 | 492.6 | 2.0
|
492.193 | |
| Green | 17.5 | 500.9 | 2.0
|
501.567 | |
| Yellow//Orange | 20.7 | 588.8 | 2.0
|
587.562 | |
| Red | 23.6 | 666.9 | 2.0
|
667.815 | |
| Dim Red | 25.1 | 706.7 | 1.9
|
??? |
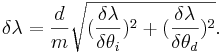
Error Analysis
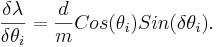
Then the total error is the sum of the two partial derivatives added in quadrature,
Conclusion
The emission spectrum for the sodium and helium sources is determined accurately; the error is under 1% and published values fall within that error. The sole exception, the error present in the second order sodium band, is considered to be due to human error during data collection rather than any deviation from the model. The symmetry about θdiff allows each measurement to be confirmed, resulting in confidence in these results.
References
[1]Kowalski et al., Spectroscopy, 2007.[2]Jenkins, F A and White, H E , Fundamentals of Optics, 4E, McGraw-Hill, 1976.