Bnibling/Acoustic Lab
Spectroscopy
Barrett Nibling, Travis Nokes, Kurt Strovink
November 6th, 2007
Contents |
Abstract
List of Figures
Introduction
Theory
A diffraction grating allows the observer to distinguish the various colors emitted from an excited gas. The grating consists of an evenly spaced 300 or 600 slit array, with a grating spacing of d. The principal intensity maxima occur where [1]:
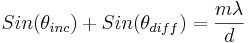 ,
,
where m is an integer representing the order and λ is the wavelength of light.
The arrangement of the apparatus indicates that θinc = 0, confirmed with symmetry about 0 degrees, so the working equation simplifies to:
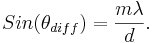
Solving for λ results in
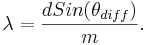
This experimental wavelength is compared to published spectra to determine the accuracy of this experiment.
Procedure
As shown below, a collimator is placed in front of the helium/sodium lamp, focusing the light into one beam. One of the two (300/mm, 600/mm) diffraction gratings is positioned level with the light source and perpendicular to the axis of the beam. A telescope is positioned level with the observed beam. When properly arranged, the light seen through the telescope is observed at 0º, as read on the Vernier scale goniometer.
The angle of the telescope eyepiece changes with reference to this 0º starting point as it is moved along the scale. This allows the observer to measure the angle at which the maxima occur for each color emitted. The location of each color band is measured and recorded. The diffraction grating is exchanged and the measurements repeated for m = 1,2.

Results
Helium Results
The following tables and graphs are the results acquired from the Helium Spectroscopy. All published values are from [2].
The First Order Spectrum:
| Color | θdiff (degrees) | λ (nm) | Error (nm) | Published λ (nm) | |
|---|---|---|---|---|---|
| Purple | 15.6 | 448.0 |  2.0 2.0
|
447.148 | |
| Teal | 16.4 | 470.3 | 2.0
|
471.314 | |
| Green | 17.2 | 492.6 | 2.0
|
492.193 | |
| Green | 17.5 | 500.9 | 2.0
|
501.567 | |
| Yellow//Orange | 20.7 | 588.8 | 2.0
|
587.562 | |
| Red | 23.6 | 666.9 | 2.0
|
667.815 | |
| Dim Red | 25.1 | 706.7 | 1.9
|
??? |

The graph above is a comparision between the wavelength calculated using the working equation and the published values, with all values when the error bars.
The following is the first order spectrum of Helium using a 300mm grating
| Color | θdiff (degrees) | λ (nm) | Error (nm) | Published λ (nm) | |
|---|---|---|---|---|---|
| Purple | 7.7 | 446.4 | 4.1
|
447.148 | |
| Teal | 8.1 | 469.4 | 4.1
|
471.314 | |
| Green | 8.5 | 492.5 | 4.1
|
492.193 | |
| Green | 8.6 | 498.2 | 4.1
|
501.567 | |
| Yellow//Orange | 10.2 | 590.0 | 4.1
|
587.562 | |
| Red | 11.5 | 664.2 | 4.1
|
667.815 | |
| Dim Red | 12.2 | 704.0 | 4.1
|
??? |
Due to the higher amount of error associated with the 300mm grating compared to the 600mm grating, about twice as much, we opted to discontinue any further data collection using the 300mm and stuck with the 600mm for the remainder of the lab.
The Second Order Spectrum:
| Color | θdiff (degrees) | λ (nm) | Error (nm) | Published λ (nm) |
|---|---|---|---|---|
| Purple | 32.5 | 447.5 | .95
|
447.148 |
| Teal | 34.4 | 470.6 | .94
|
471.314 |
| Green | 36.4 | 491.6 | .94
|
492.193 |
| Green | 37.0 | 501.3 | .93
|
501.567 |
| Yellow//Orange | 44.9 | 588.0 | .89
|
587.562 |
| Red | 53.3 | 667.9 | .85
|
667.815 |

In the second order domain, the error is about half of the error in the first order. Even so, all the values when compared to published values are within the error bars.
Sodium Results
The following tables are the result acquired from the Sodium Spectroscopy. Again, the published results are from reference [2].
The First Order Spectrum: In the first order spectrum there are many lines and using the data from the Helium portion of the lab determined that the Sodium has Helium contamination. By substracting all the known Helium lines, all that was left is a bright orange line. By focusing the slit, it was determined to actually be 2 orange lines, this can be seen better in the second order spectrum. Due to the proximity of the lines, less than .1 degrees apart, one measurement was taken and the published values were averaged.
| Color | θdiff (º) | λ (nm) | Error (nm) | Published λ (nm) |
|---|---|---|---|---|
| Orange | 20.7 | 588.8 | 1.99
|
589.294 |
Second Order Spectrum: In the second order, all the contamination was removed and only the oranges lines were seen.
| Color | θdiff (degrees) | λ (nm) | Error (nm) | Published λ (nm) |
|---|---|---|---|---|
| Orange | 46 | 594.14 | .89
|
589.294 |
Error Analysis
For the error analysis, there are two variable associated with an error, θd and θi.
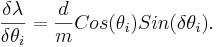
The partial errors for each of the variable are calculated from the formulas
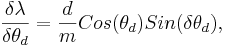
and,
Then the total error is the sum of the two partial derivatives added in quadrature,
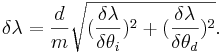
The values for δθd and δθi used are half the value of the smallest unit of measure on the device, .05 degrees.
Conclusion
The emission spectrum for the sodium and helium sources is determined accurately; the error is under 1% and published values fall within that error. The sole exception, the error present in the second order sodium band, is considered to be due to human error during data collection rather than any deviation from the model. The symmetry about θdiff allows each measurement to be confirmed, resulting in confidence in these results.
References
[1]Kowalski et al., Spectroscopy, 2007.[2]Jenkins, F A and White, H E , Fundamentals of Optics, 4E, McGraw-Hill, 1976.