Badboys/template
From Physiki
Gamma Ray Attenuation
Barrett Nibling, Adolfo Gomez, Micheal Bouchey
February 6, 2008
Contents |
Abstract
abstract here
List of Figures
- figure 1
- figure 2
- figures 3
Introduction
intro here
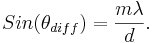
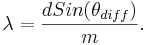
Theory
Theory here
Example Math:
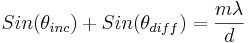 ,
,
Procedure
procedure here
Example Image:

Results
Data here
Results 1
Example Table
The First Order Spectrum:
| Color | θdiff (degrees) | λ (nm) | Error (nm) | Published λ (nm) | |
|---|---|---|---|---|---|
| Purple | 15.6 | 448.0 |  2.0 2.0
|
447.148 | |
| Teal | 16.4 | 470.3 | 2.0
|
471.314 | |
| Green | 17.2 | 492.6 | 2.0
|
492.193 | |
| Green | 17.5 | 500.9 | 2.0
|
501.567 | |
| Yellow//Orange | 20.7 | 588.8 | 2.0
|
587.562 | |
| Red | 23.6 | 666.9 | 2.0
|
667.815 | |
| Dim Red | 25.1 | 706.7 | 1.9
|
??? |
Results 2
Error Analysis
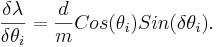
For the error analysis, there are two variable associated with an error, θd and θi.
The partial errors for each of the variable are calculated from the formulas
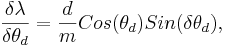
and,
Then the total error is the sum of the two partial derivatives added in quadrature,
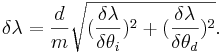
The values for δθd and δθi used are half the value of the smallest unit of measure on the device, .05 degrees.
Conclusion
conclusion here
References
[1]
[2]