Week of 11/5
(Difference between revisions)
| Line 25: | Line 25: | ||
Sampling theorem. See 10/31/07 lecture notes | Sampling theorem. See 10/31/07 lecture notes | ||
| + | |||
| + | |||
| + | |||
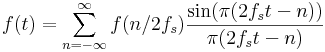
| + | We end up with | ||
| + | <math> | ||
| + | f(t) = \sum _ {n = - \infty} ^ \infty f(n/2f_s) \frac{\sin(\pi (2 f_s t -n))}{\pi (2 f_s t -n)} | ||
| + | |||
| + | </math> | ||
Revision as of 16:28, 5 November 2007
Here is the display of my oscilloscope when the input is a 1000 pulse per second output of a time-code generator. (The time-code generator is a device that locks to the 10 MHz output of an atomic clock and produces 1 Hz or 1 KHz pulse trains as well as human readable time synchronized to the atomic standard.)

I imported the data and plotted it along with its periodogram.

Notice that only the odd harmonics are present.
Here is a mathematica notebook that simulates this.
| |
Sampling theorem. See 10/31/07 lecture notes
We end up with